-
Introduction
In line with the OpenRisk guideline, the risk analysis process follows four basic steps. The steps are embedded in each of the tools/methods offered, but the degree of implementation and fulfilment varies:
- Estimating the probability of the event occurrence
- Estimating the severity of the consequences in case of event occurrence
- Assessing the strength of the evidence for the probability and consequence estimation
- Combining probability, consequence, and strength of evidence in a risk scale.
In the following, the guideline distinguishes between two types of risk analysis; Governance-Oriented Risk analysis (Screening, Intermitten and Strategic) and Operational/voyage Risk Analysis. The Governance-Oriented analysis are further divided into: A) Ship Traffic Risk, and B) Environmental Risk and Sensitivity.
-
Voyage and operations risk analysis
Below is a list of specialized tools for conducting risk assessment of voyages in arctic (in alphabetic order):
- Canadian Arctic ice Regime Shipping System (AIRSS). The AIRSS is intended to minimize the risk of pollution in Arctic waters due to damage of vessels by ice; to emphasize the responsibility of the shipowner and master for safety; and to provide a flexible framework for decision-making. Ice Numeral is used to decide whether the vessel should proceed or take an alternative route.
- Canadian Arctic Shipping Risk Assessment System (CASRAS). Provides a comprehensive software-based system for the storage, search and visualization of all key environmental data with specific application to shipping, icebreaking and mitigation in northern waters and Arctic marine corridors.
- Polar Operational Limit Assessment Risk Indexing System (POLARIS). POLARIS uses a Risk Index of Risk Values (RIVs) which are assigned to a ship based on the ice class. The RIVs may be used to evaluate the limitations of the ship operating in an ice regime using input either from historic or current ice charts for voyage planning or in real time from the bridge of the ship.
-
Governance-Oriented Risk Analysis (Screening, Intermittent and Strategic Risk Analysis)
Methods for screening, intermittent and strategic risk analysis are aimed to provide government and authorities a quantitative tool for estimating the probability of ship accidents in a given waterway or sea area. The tools can be used to analyses the risk of current ship traffic conditions, as well as for scenarios involving changes in traffic volume or fleet composition, changes routes, or changes in the applied Aids to Navigation (AtoN), or inclusion of other risk mitigation options
Best practice quantitative risk calculation methods incorporate the following elements:
- High resolution AIS data; for increased traffic image accuracy in fjords and narrow passages.
- Full year, preferably multiple year AIS data; to capture seasonal variations.
- Enriches AIS data with ship data bases; for detailed ship characteristics (type, length, size, number of crew and passengers).
- Up-to-date causal data and accident/incident statistics; to derive probabilities of accidents, fatalities and oil spills.
- Grid system, preferably down to 10x10km or 1x1km, to calculate; to calculate and present risk in each grid cell.
- Geo databases; for coastal and hydrographic/bathymetry data.
- Quantification of relevant ARIFs; to include relevant factors that may be increase the risk level.
Applying the elements above will ensure risk assessment are more harmonized in terms of their inputs and outputs. Models and methods that applies several of these elements are; (listed in alphabetic order);
- AISyRisk: The AISyRisk model comprises novel high-resolution AIS-data-based approaches for calculating grounding and collision accident frequencies. Additionally, existing models for fire, explosions, and foundering accidents have been adapted for use with AIS data input. The model outputs in grid system; accident frequencies, spill frequencies, loss of life and oil spill frequencies. Earlier version of the methodology in AISyRisk has been applied in Barents Sea, North Sea and waters around Svalbard and Greenland.
- Be-Aware: Area‐wide risk assessment model; focus on oil spills and hazardous liquid substances from shipping accidents or from other offshore activities. The methodological principles are taken from the methodology of the BRISK project (BRISK, 2012) and adjusted to the specific conditions of the North Sea area. The model has been applied in the Greater North Sea and its wider approaches, as part of the co-financed EU project BE‐AWARE.
- IWRAP - IALA Waterway Risk Assessment Programme. The IWRAP MK II tool is based on a model for calculating the collision and grounding frequency on a specific route. This model involves a so-called causation probability, which is multiplied with a theoretically obtained number of grounding and collision candidates. IWRAP has been applied in many local risk assessments of specific fairways.
- MarinRisk: The MarinRisk tool can be used to estimate the total expected number of accidents, oil spills and associate costs, for each ship for each area for which AIS data is available, by using a risk index. The aim of the Nautical Risk Index is to determine the contribution of the total risk of an individual vessel. Also, when all risk numbers are aggregated for a certain area, the total risk value of that area (grid system) can be determined. The general risk modelling is based on the ideas of SAMSON (Safety Assessment Model for Shipping and Offshore on the North Sea). Contact: Maritime Research Institute Netherlands (MARIN).
- SAMSON - Safety Assessment Model for Shipping and Offshore on the North Sea. The Model calculates the frequency, volume, location and oil type of a potential ship-source oil spill within each grid cell. The model has been applied in “Transport Canada Area Risk Assessment Methodology Development for Ship-Source Oil Spills in Canadian Waters”.
A comprehensive review of all available methods and tools are provided in OpenRisk Guideline for Regional Risk Management to Improve European Pollution Preparedness and Response at Sea.
Note that this guideline does not include offshore accidents, thus ship installation collisions are omitted.
-
Best practice models on including ARIFs
The list presents best practice screening-, intermittent- and strategic models on including ARIFs.
Arctic Risk Map
Quantitative Risk model using Safety and Operability Index (SOI), giving a rating to risk factors relevant to Arctic operation.
Physical factors included in the SOI:
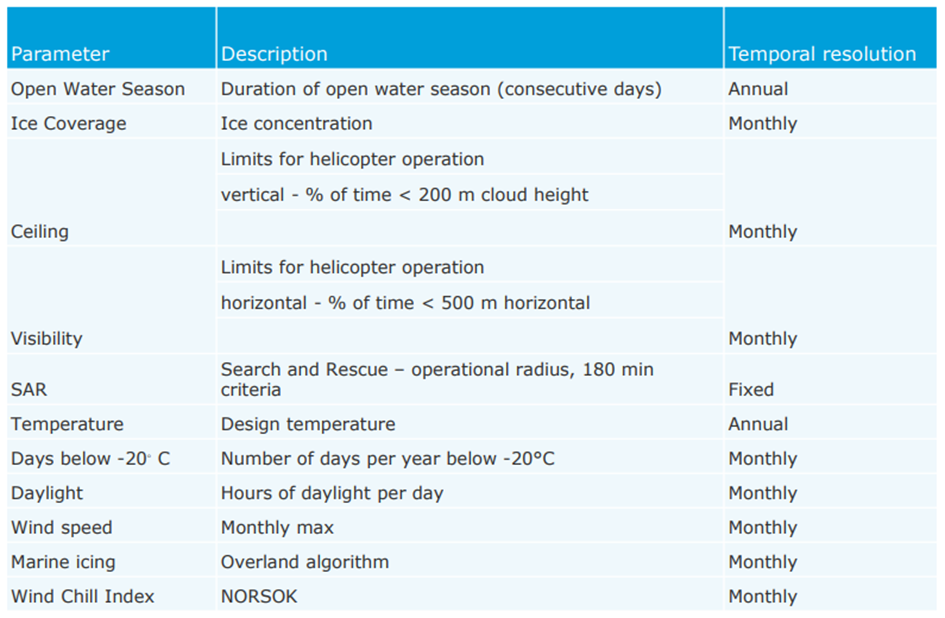
The principal factors are known to affect safety and operability in the Arctic region. They are benchmarked against recognized standards [NORSOK] and a baseline risk-level of operations in the Norwegian Sea.
Modalities of human error play a significant role in assessing risks in extreme environments. Many studies show human perception and response can be greatly affected when exposed to extreme conditions. In line with the Polar Code, ensuring a safe and workable working environment, is therefore paramount to reducing the likelihood of human error. Remoteness, cold temperatures, wind, darkness, and perpetual daylight are all physical factors which influence on human judgement and behavior. Circumstances such as impaired visibility together with strong winds and freezing temperatures may lead to fatigue and disorientation, which in turn, impacts on decisions in the face of hazards. Also, the operability of safety critical equipment, may be impaired due to icing and other factors, and this can adhere to elevated risk.
The safety and operability index reflect when work outdoors can be performed safely, and under which circumstances it must be avoided. The index is rooted in the NORSOK standard S-002 on an Arctic working environment.
HFO in the Arctic – Risk Model. This study was carried out on behalf of PAME. It identifies the risks associated with the use and carriage by ships of HFO in the Arctic.
Marine Environmental Risk Assessment for Greenland – Risk Model.
Oil Spill Contingency Study for Greenland – Risk Reduction and Oil Spill Response
There are also several papers on quantitative risk analysis for arctic shipping:
-
Environmental risk and sensitivity
The environmental risk part of the marine risk assessment builds upon the ship risk assessment and quantified probabilities for spill of various hazardous substances. The approach is to assess the potential ecological and sometimes socio-economic consequences of such spills by considering the sensitivity of different types of environments to spill-related damage.
The approach includes mapping of sensitive areas and periods and a vulnerability assessment towards the different spill types. Sometimes, the approach includes spill modelling in order to account for the fate and trajectory of the spill.
The EPPR screening study shows that few of the environmental risk methods and approaches considered specific factors for arctic environments directly, the arctic elements are more often reflected indirectly in the data and datasets used to determine vulnerability and consequence potential.
A short overview of the most relevant best practises for marine environmental risk assessment are given below:
Assessment of Marine Oil Spill Risk and Environmental Vulnerability for the State of Alaska. NOAA. RPS ASA, Env Research Cons., RPI, Louis Berger Group (2014) including a Spill Risk Calculator tool. Assessment intended to identify broad regions and seasons within Alaska having both high relative environmental vulnerability and high relative oil spill probabilities and spill volumes. The report also includes a Literature review of methods for vulnerability and risk assessments. The method has included sea ice as a separate habitat in the vulnerability assessment.
Environmental Risk Assessment of oil spills from shipping activities around Svalbard and Jan Mayen. Norwegian Coastal Administration. DNV GL (2014). In Norwegian. This approach was followed up in the Greenland assessment below.
Risk Assessment for Marine Spills in Canadian Waters: Phase 1: Oil Spills South of 60th Parallel. This study estimates the risk of pollution from marine oil spills in Canadian waters south of the 60th parallel.
Risk Assessment for Marine Spills in Canadian Waters. Phase 2, Part B: Spills of Oil and Select HNS Transported as Bulk North of the 60th Parallel North. Transport Canada. WSP / SL Ross (2014). The methodology was developed to best represent and compare the relative risk of pollution from ship-source spills of oil products and select HNS transported in bulk in Canadian arctic waters (18 sub-sectors). The assessment includes ice as shoreline type and made some adjustment of the Human-use index to arctic conditions (incl. Coastal Population Index).
Sub-Regional Risk of Spill of Oil and Hazardous Substances in the Baltic Sea (BRISK), HELCOM 2009-2012
BE-AWARE I and II. Bonn Agreement. COWI (2012-15). Had the objective to identify the most effective risk reducing (RRM) and response measures (RM) for the five project sub-regions in the North-sea based upon: the risk and size of oil spills calculated in the BE-AWARE I project, modelling of the outflow of oil from those spills, an environmental and socioeconomic sensitivity analysis and a combined impact assessment. Includes a comprehensive vulnerability assessment (not arctic specific) of sensitive features and socio-economic features.
Some arctic considerations towards elements in the environmental risk assessment is given below:
Spreading and fate of oil spill
None of the methods for marine risk assessment in arctic waters have applied oil spill modelling in ice, although such short-duration modelling is feasible with existing oil spill models.
For regional assessments that want to support more site-specific consequence maps (grid cell level), modelling of spill trajectory and fate can be performed for open-sea areas or areas with lower ice concentrations. A simplified approach can be followed by applying a look-up spill radius for each oil type and volume category (ref. Greenland assessment) or more detailed as Strategic modelling in homogenous areas (ref. BE-AWARE II).
For site-specific risk assessments, modelling of spill trajectory and fate were performed. This could be as a stochastic approach to cover variations in weather (winds/currents) within different seasons (ref. Canada south of 60th) or for selected spill scenarios (most probable, worst case etc.) at risk hot-spots (ref. Canada approach for ship-source spills).
Vulnerability assessment
The environmental vulnerability of an area will scale the environmental consequence from a spill in terms of seriousness of impact towards different habitats, species or species groups, protected areas, socio-economic resources or human-use of an area. Most regional-scale risk assessments use some type of environmental vulnerability index, but different methods and criteria is in use with different data requirements to support the vulnerability assessment. Separate vulnerability scores are applied for species (birds, marine mammals, fish) and habitats (bottom, shoreline). The Alaska assessment (ref) have included sea ice as a separate habitat type in the vulnerability assessment.
For socio-economic features, Canada did some arctic adjustments to the Human-Use Resource index north of 60th, by including a coastal population index (ref). In general, cultural features are more influenced by national prioritisations and seems harder to harmonise in an arctic context.
As the arctic ecosystem are influenced by very dynamic and seasonal processes, a high temporal resolution in data seems necessary to capture the various possible outcomes in consequence of a spill in the arctic marine environment. This is relevant to capture the dynamics in areas of high biological productivity like the marginal ice zone, polar front areas or polynyas, but also with regards to abundance of species and the variation in spill vulnerability related to behavioural aspects and ecological use of areas for different purposes (spawning, nursery, migration, wintering, staging, moulting, breeding, feeding etc.).
The spatial resolution of data needed depends on the objective of the risk assessment and may span from AMSA IIc data of areas of heightened ecological significance (AMAP, CAFF, SDWG, 2014) down to very specific datasets like the Ecological Atlas of the Bering, Chukchi, and Beaufort Seas (Audubon, 2017). The latter represents a comprehensive and well documented dataset covering both the biological environment (fish, birds, mammals, primary productivity, ice phytoplankton concentration, zooplankton, benthic biomass) and the physical environment (ocean currents, sea ice, climate) at a monthly resolution.
Environmental consequence and risk
The endpoint in the environmental risk assessments combines the input from the spill risk with the environmental vulnerability and is typically expressed with relative consequence and risk categories
Some relevant risk expressions are outlined below:
· Risk = Oil modified Environmental Vulnerability x Incident rate x Spill Volume (NOAA 2014)
· Env. Risk index (ERI) = Frequency x Quantity x Env. Sensitivity Index pr. sub-sector (Transport Canada, 2014)
· Risk score = Frequency of exposure (FOE) x Consequence of exposure (COE) (Transport Canada, Dillon 2017)
· Risk = Probability for 6 consequence categories (Defence Command Denmark; DNV GL 2015)
· Risk of damage = Vulnerability x Average impact of oil (water column, sea surface) (Bonn Agreement; COWI 2015)
It seems beneficial to harmonize the consequence and risk categories to enable more comparable assessments.